
Growing fast. Flying blind. Not anymore.
Industry
Retail & Hospitality
Company size
200 - 500 Employees
About
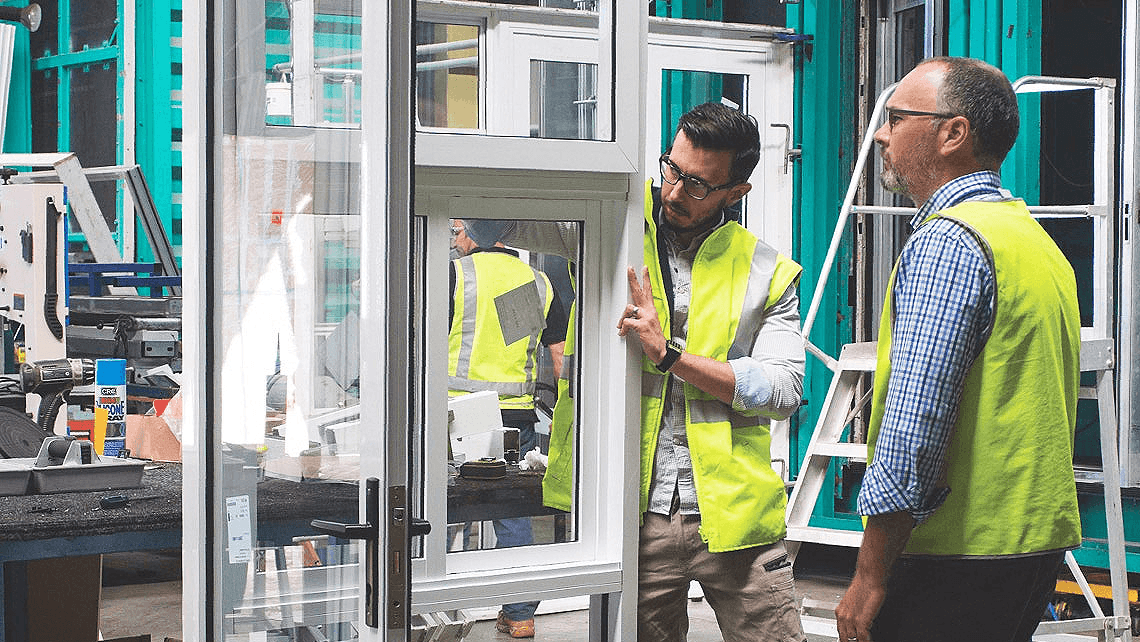
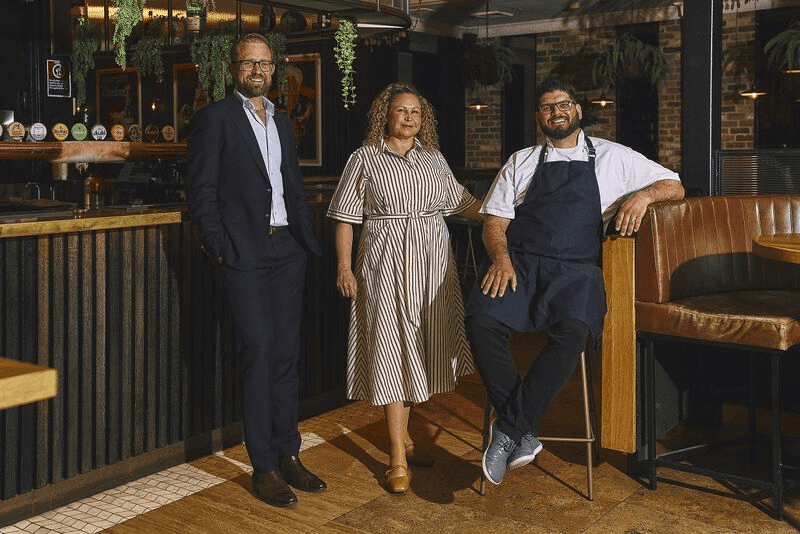
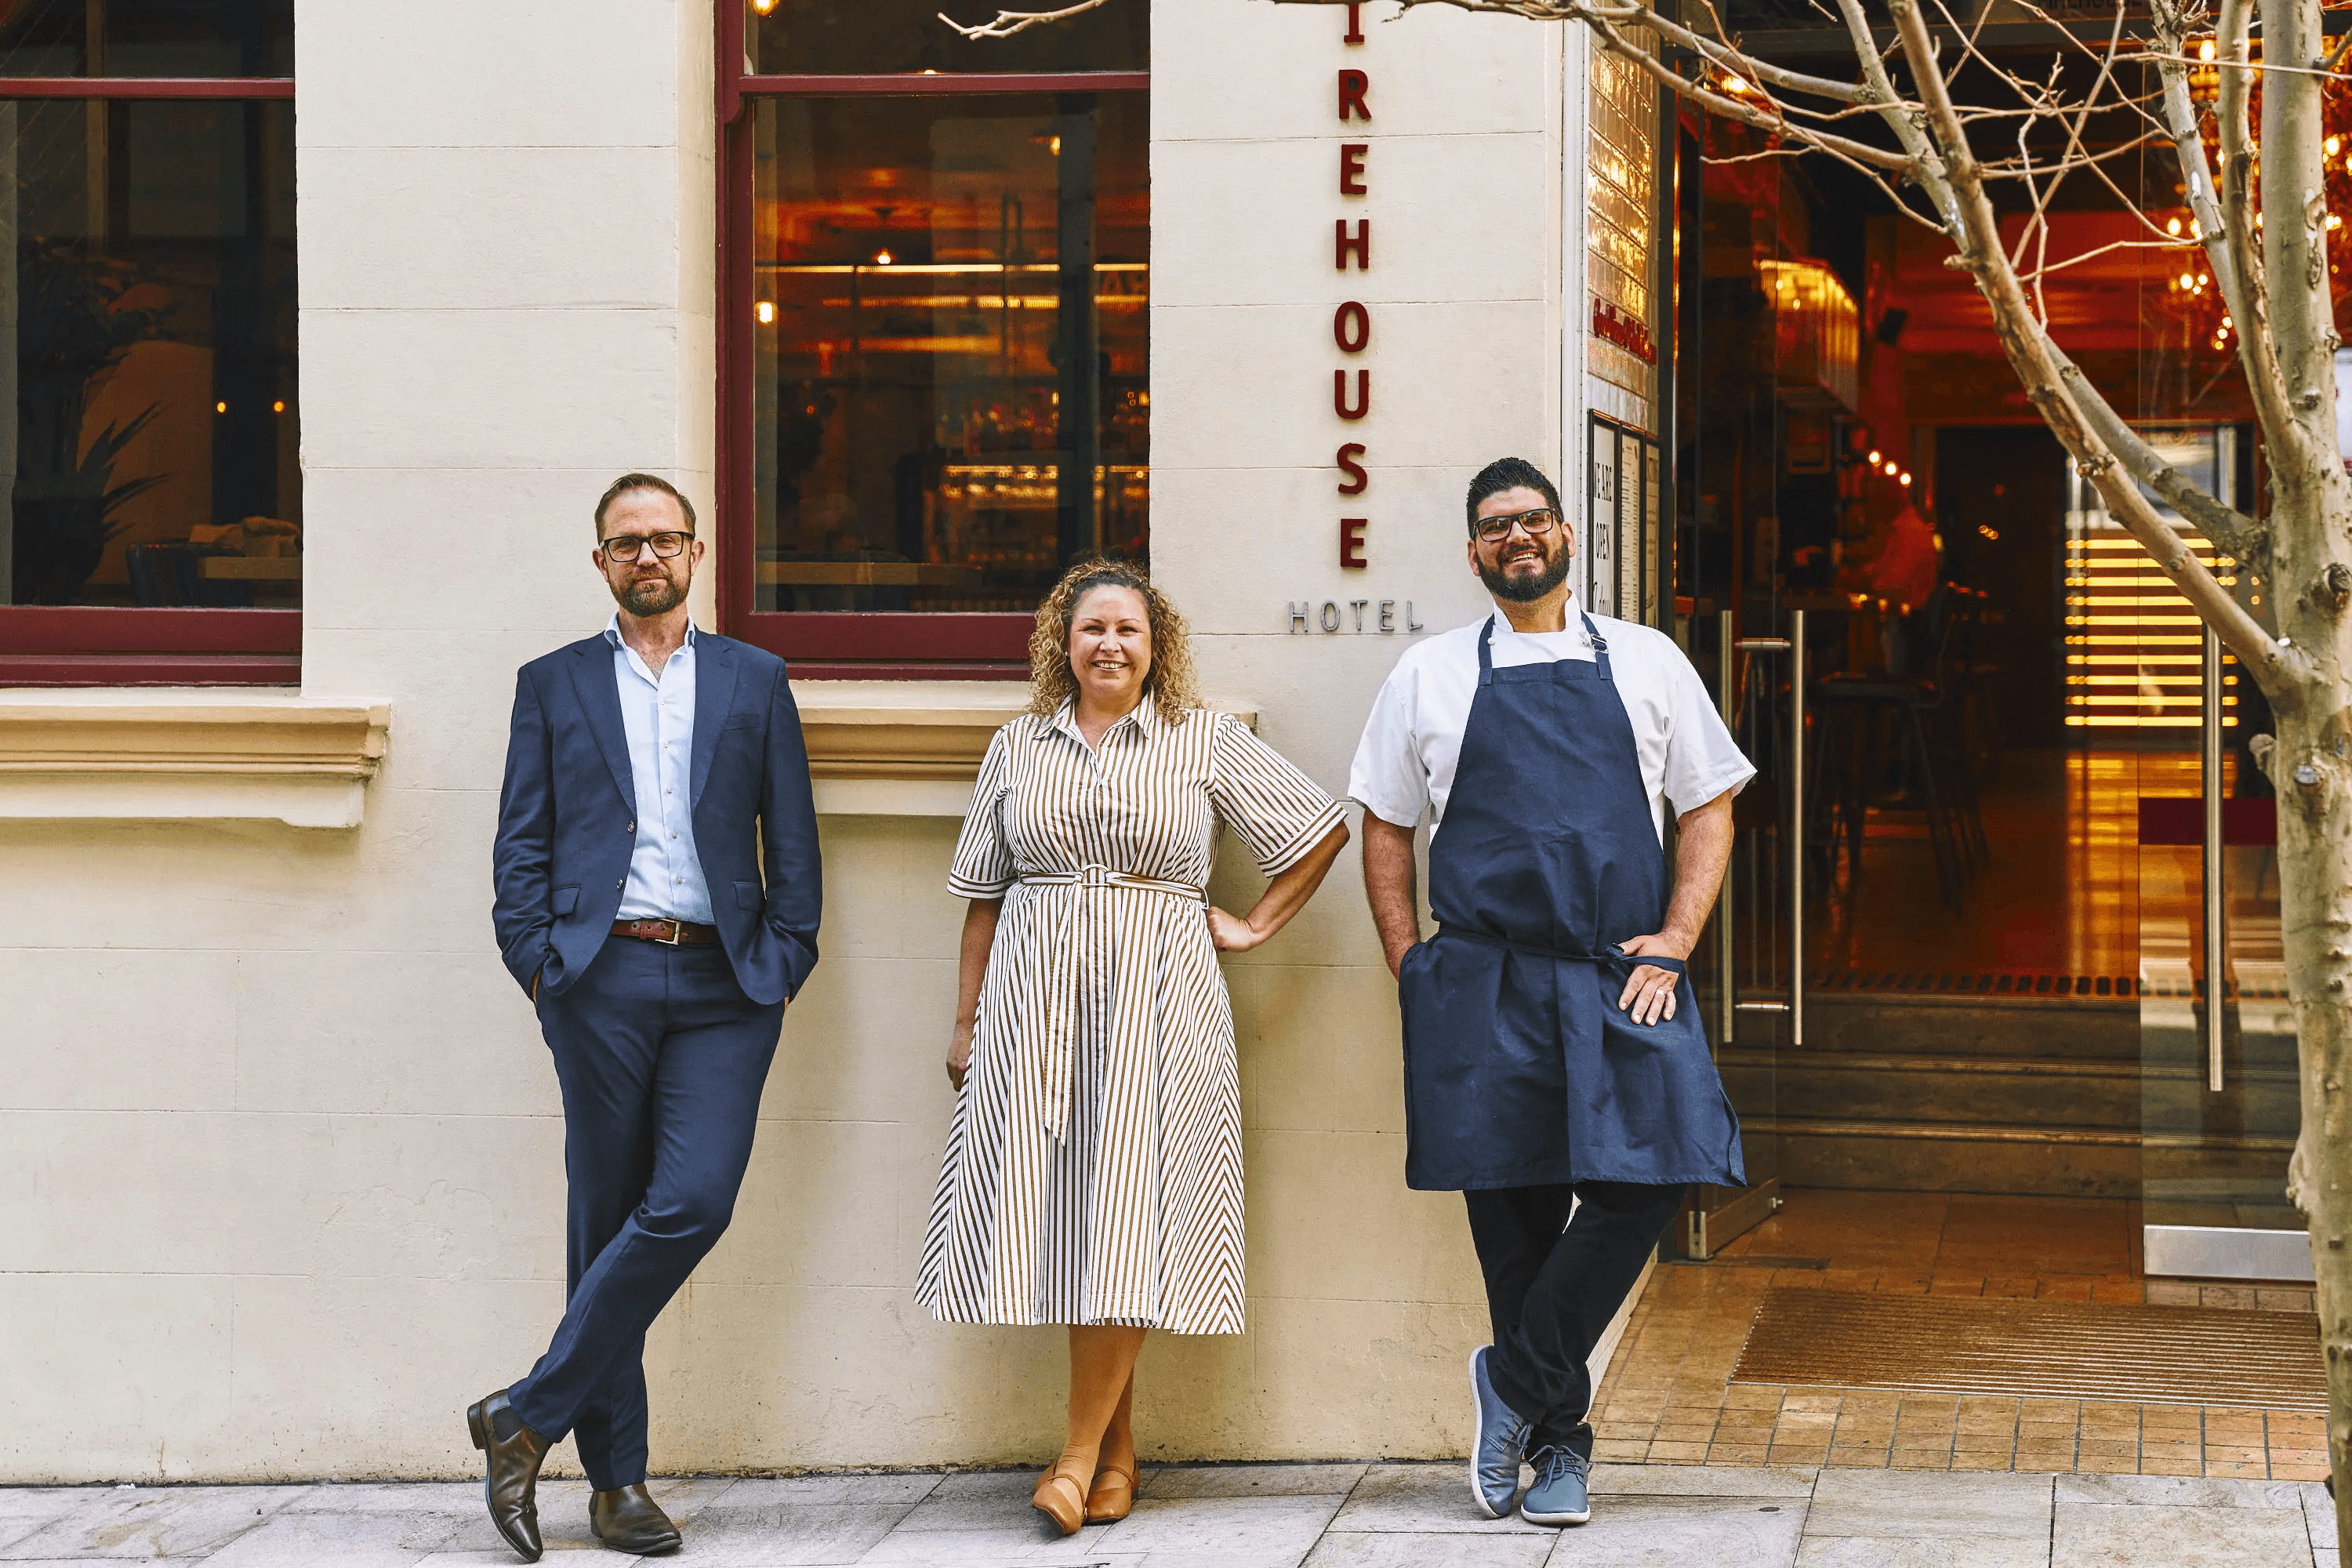
Sonnel Hospitality is a major Australian pub group that operates a diverse collective of vibrant dining, drinking, and accommodation hubs. Under the leadership of CEO Simon Meers, the company is dedicated to revitalizing local venues into premium, community-first lifestyle destinations.
“Working with Halcrow is just like working with internal teams—we treat them as our own employees. They integrated so well with our operations to give us the engineering resources and expertise we need to meet the growing demands of our business.”

30 sec
Before: "What's our average customer spend per visit across venues?" Process: Export POS data for each venue, load into Excel, manually reconcile customer IDs (different formats per system), calculate average, aggregate. Time: 2-3 days. After: 30 second SQL query against warehouse.
100+ metrics real-time
Strategic questions answerable: 100+ metrics real-time vs. ~10 metrics monthly pre-warehouse
We've been inside enough initiatives to know where the value actually is and where businesses waste on technology.
Book Your Diagnostic Call
The Situation
Sonnel Hospitality Group operates multiple venues across Sydney. Pubs, hotels, restaurants. By 2019, they were in growth mode: acquiring new properties, expanding existing ones, bringing new concepts to market. Revenue was growing. Foot traffic was increasing. But their internal systems were struggling to keep pace.
Each venue generated data. POS transactions, inventory movements, staff rosters, customer preferences, booking patterns. But that data lived in isolated silos. IdealPOS for transactions. Separate systems for rostering. Excel spreadsheets for financial reporting. Manual processes to reconcile cash management across venues.
When leadership wanted to answer basic questions
"Which venue is most profitable per square meter?"
"What's our customer repeat rate across the portfolio?"
"Where are we losing money on inventory waste?"
Getting answers required days of manual data extraction and Excel gymnastics.
Cash management across multiple venues was a manual nightmare. Each venue handled cash differently. End-of-day reconciliation required venue managers to manually count, record, and report to head office. Discrepancies were common. The lag between a cash transaction and head office visibility was 24-48 hours. Which was too slow for a growing hospitality group that needed real-time financial visibility.
But cash management was a symptom, not the disease. The structural problem was systems fragmentation. Sonnel had accumulated a patchwork of point solutions over years of growth. Each worked individually. None worked together. As they scaled, the operational overhead of managing disconnected systems was becoming a constraint on growth.
Why they called us
Sonnel didn't call Halcrow to "build an app." They called us because they'd recognised a pattern: every time they tried to answer a strategic question about their business, they hit a data problem.
Most hospitality groups solve this by buying "enterprise hospitality software"—massive platforms that promise to do everything. Sonnel had looked at these. The problem: implementation timelines were 12-18 months, costs were $500K-$1M+, and these platforms required complete operational change. "Rip out your existing systems, adopt ours."
Sonnel didn't want to replace their operations. They wanted to integrate what they already had and fill the gaps with custom capability where needed.
Why Halcrow specifically: We'd worked with hospitality groups before. We understood that POS systems, booking platforms, and rostering tools are commodity infrastructure—you don't rebuild them, you integrate with them. The value isn't in replacing proven operational systems. It's in building the data layer that connects them and the business intelligence tools that extract insight.
Law 1 (Structural Distance): Most integration projects fail because the people designing them are too far from daily operations. We embedded directly in Sonnel's business—spending time in venues, watching cash reconciliation processes, understanding where manual overhead lived.
How we worked
Unlike project-based engagements (arrive, integrate, leave), Sonnel was continuous embedding. Halcrow operated like Sonnel's internal technology team:
Team structure:
1 data engineer (warehouse architecture, ETL pipelines, POS integration)
1 backend engineer (API layer, cash management system, financial reporting)
1 infrastructure specialist (AWS, security compliance, backup strategy)
1 product lead (Sonnel/Halcrow interface, requirements → implementation)
Critical embedding elements:
Direct access to venue operations: We weren't integrating from a distance. We spent time in venues, watched cash counts, understood edge cases
Shared infrastructure: Direct AWS access, POS API credentials, financial system integration—no "submit a ticket" overhead
Law 3 (Direct Infrastructure Access): We worked inside Sonnel's technical environment. When POS data wasn't syncing correctly, we could diagnose and fix it directly instead of going through vendor support channels.
Phase 1: Cash Management System (2019-2020)
Objective: Automate cash reconciliation, provide real-time visibility to head office.
Problem anatomy:
8 venues, each handling significant cash per week
Manual counting, recording, safe storage
Venue managers submitted reports via email/Excel
Head office manually reconciled against POS transaction data
Discrepancies required phone calls, re-counts, investigation
Time from cash transaction to head office visibility: 24-48 hours
Solution architecture:
Built custom cash management system integrated with POS
Venue managers enter cash counts via web interface
System automatically reconciles against POS transaction data
Flags discrepancies >$50 for investigation
Real-time dashboard for head office: see cash position across all venues instantly
Edge cases that emerged during rollout:
Gaming machine cash-outs: All venues have poker machines. Players cash out with printed tickets. Tickets redeemed for cash at bar. POS doesn't track this because it's venue-specific hardware. Had to integrate with gaming machine API to capture ticket redemptions.
Staff cash advances: Venue managers sometimes advance cash to staff (e.g., emergency loan, uniform purchase). These weren't tracked systematically. Added "cash advance" recording to system—captured in reconciliation, flagged for payroll.
Safe float adjustments: Each venue maintains a safe float (starting cash for next shift). Managers sometimes adjust float up/down based on anticipated volume. System needed to track float changes separately from revenue/expenses.
Phase 2: Data Warehouse Foundation (2020-2021)
Objective: Consolidate data from all operational systems into a central warehouse.
Data sources:
IdealPOS (transaction data, inventory, sales mix)
Booking platform (reservations, no-shows, customer contact info)
Rostering system (staff schedules, labor costs, attendance)
Cash management system (built in Phase 1)
Financial system (P&L, expenses, supplier invoices)
Technical architecture:
Central data warehouse (AWS Redshift)
ETL pipelines: extract data from source systems, transform to common schema, load to warehouse
Scheduled syncs: POS data every 15 minutes, financial data daily, rostering weekly
Data quality checks: automated validation to catch missing/malformed data
Why this unlocked strategic decision-making:
Before: "What's our average customer spend per visit across venues?" Process: Export POS data for each venue, load into Excel, manually reconcile customer IDs (different formats per system), calculate average, aggregate. Time: 2-3 days.
After: SQL query against warehouse. Time: 30 seconds.
Law 8 (Capability Transfer): We didn't build the warehouse and keep it proprietary. We trained Sonnel's finance team to write SQL queries, create custom reports, analyze trends themselves.
Phase 3: Business Intelligence Layer (2021-2022)
Objective: Self-service reporting for leadership and venue managers.
Tools built:
Venue performance dashboard: Revenue, margin, labor cost%, customer count, comparison to previous period and other venues
Inventory analytics: Waste tracking, supplier cost trends, order optimization
Customer insights: Repeat rate, lifetime value, booking patterns, no-show trends
Labor optimization: Staff productivity, wage cost as % of revenue, optimal rostering patterns
Example of impact:
Sonnel discovered one venue had 23% higher food waste than others. Dug into data: kitchen was over-prepping lunch specials based on historical average, but actual demand varied significantly by day of week. Implemented day-specific prep targets. Food waste dropped 9% in 6 weeks. Savings: ~$18K/year at that venue.
Phase 4: Security & Compliance (2023-2024)
Objective: Cybersecurity compliance, data protection, backup strategy.
As Sonnel scaled, regulatory requirements increased. Customer data protection (privacy regulations). Financial data security (PCI compliance for card transactions). Operational continuity (backup/recovery plans).
Work completed:
Security compliance assessment (identified gaps, prioritized remediation)
Microsoft Entra SSO integration (centralized authentication, eliminated password sprawl)
Cross-AWS account backup strategy (automated backups, tested recovery procedures)
JIRA-tracked risk management (security issues tracked, assigned, resolved with audit trail)
Law 9 (Incremental Exposure Reduction): Didn't attempt "big bang" security overhaul. Prioritized highest-risk gaps first, implemented controls incrementally, validated each before moving to next.
Phase 5: Advanced Integration (2025-2026)
Objective: Deeper data consolidation, predictive analytics, operational automation.
Recent projects:
Lexer CDP integration: Consolidate customer data from POS, booking platform, loyalty program into unified customer data platform
Pricing algorithm productization: Dynamic pricing for hotel rooms and event bookings based on demand forecasting
Data lakehouse architecture: Transition from traditional warehouse to lakehouse (combine structured + unstructured data for advanced analytics)

WHAT CHANGED
Cash Management (2026 vs. 2019):
Reconciliation time per venue: 8 minutes (down from 45-90 minutes manual)
Discrepancy rate: <0.3% of cash transactions (down from 2.1%)
Time to head office visibility: Real-time (down from 24-48 hours)
Manual overhead eliminated: ~18 hours/week across 8 venues
Data & Reporting (2026):
Ad-hoc report generation: 30 seconds (down from 2-3 days)
Strategic questions answerable: 100+ metrics real-time vs. ~10 metrics monthly pre-warehouse
Finance team self-sufficiency: 85% of reports generated internally without Halcrow
Operational Efficiency (2026):
Food waste: Reduced 9% at target venue through data-driven prep optimization
Labor cost optimization: Identified $120K/year in inefficient rostering patterns
Inventory savings: $45K/year from supplier cost trend analysis
System Uptime (2026):
Data pipeline reliability: 99.6% uptime
Security incidents: 0 major breaches (strong compliance posture)
Backup recovery tested: Quarterly validation, <4 hour RTO
Qualitative Shifts
Before (2019): "We're growing fast but flying blind. We don't know which venues are actually profitable until month-end financials come in. By then, we've lost the ability to make timely decisions."
After (2026): "We can see real-time performance across the entire portfolio. When something's off, we know immediately. Data drives every strategic decision we make."
WHY THIS WORKED
Most hospitality technology projects fail because they try to replace operational systems wholesale. "Rip out your POS, adopt ours." That's disruptive, expensive, and risky.
Sonnel worked because we embraced the integrate, don't replace model:
Law 1 (Structural Proximity): We embedded in Sonnel's daily operations. Spent time in venues. Watched cash counts. Understood edge cases. Distance kills integration projects—you can't design systems for operations you haven't observed.
Law 8 (Capability Transfer Scales): We didn't keep data expertise proprietary. We taught Sonnel's finance team SQL, showed them how to build reports, transferred analytical capability. By Year 4, they were self-sufficient for 85% of reporting needs.
Law 11 (Outcome-Defined Success): Outcome bonuses tied to operational efficiency. If cash reconciliation stayed manual, we didn't get paid in full. If data warehouse didn't reduce reporting overhead, we ate the cost. No "we delivered what you asked for" finger-pointing.
what you're buying
Ready to consolidate your systems? Contact Sam Halcrow on 0431197004 or sam@halcrow.com.au
Case study written May 2026. Sonnel Hospitality Group is a real client. IdealPOS, Lexer CDP are real platforms. All data sourced from integration documentation, operational reviews, and client metrics. This engagement is ongoing.
See how other teams are winning with Halcrow

Application Recovery, Maturity Uplift, and Structured Hand-Back
Metric #1
Metric #1 description
Read more